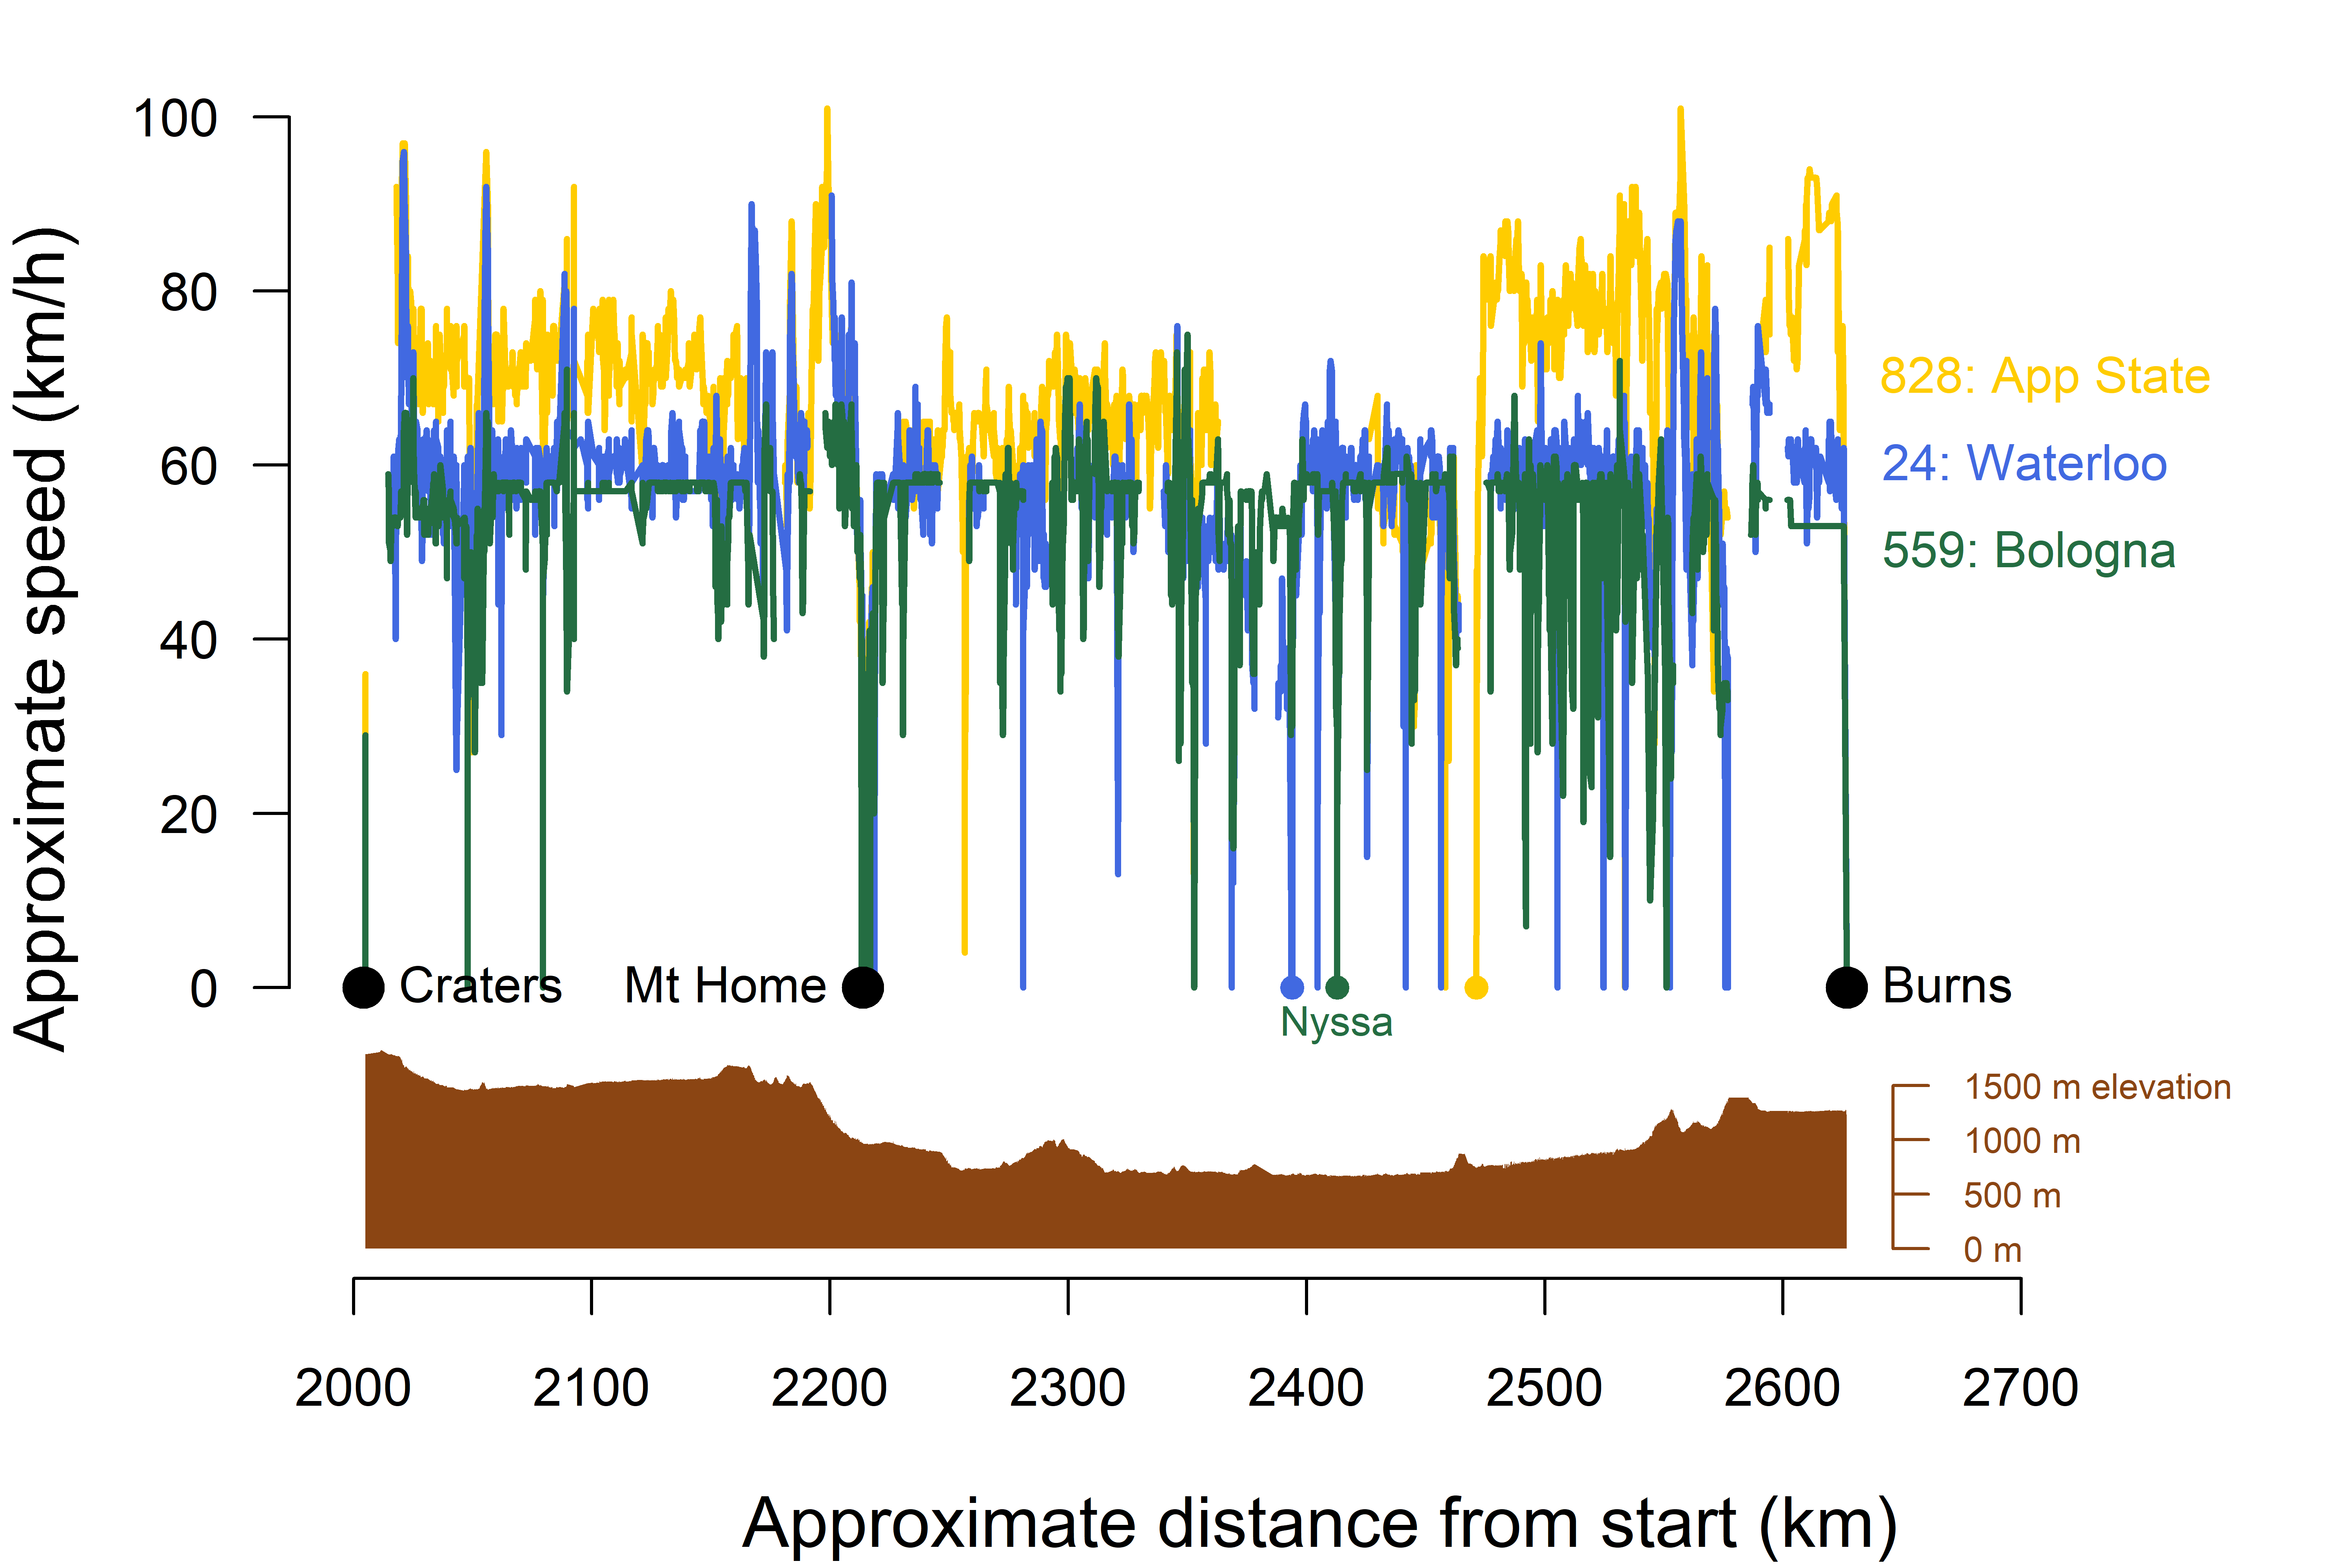

I recently got my hands on the GPS tracker data for the American Solar Challenge last July. Above (for the 6 Challengers completing the stage) and below (for the Cruisers) are distance/speed charts for the run from Craters of the Moon to Burns, which seems the stage of the route with the best data (at this time of year I haven’t the time for a more detailed analysis). Click on the charts to zoom. Small coloured circles show end-of-day stops.
Stage times were 15:Western Sydney 8:05:16, 101:ETS Quebec 8:20:13, 2:Michigan 8:25:08, 55:Poly Montréal 8:42:52, 4:MIT 9:07:58, and 6:CalSol 9:30:12 for Challengers, and 828:App State 10:22:37, 559:Bologna 12:13:57, and 24:Waterloo 15:29:12 for Cruisers (note that Bologna was running fully loaded on solar power only, while the other Cruisers recharged from the grid).
The data has been processed by IOSiX. I’m not sure what that involved, but I’ve taken the data as gospel, eliminating any datapoints out of hours, off the route, or with PDOP more than 10. Notice that there are a few tracker “black spots,” and that trackers in some cars work better than in others. The small elevation charts are taken from the GPS tracker data, so they will not be reliable in the “black spots” (in particular, the big hill before Burns has been truncated – compare my timing chart).